
Source separation in the presence of real-world background noise
Since the ultimate goal of sound source separation techniques is to separate sources in the real world, we propose an evaluation of source separation in the presence of real-world background noise.
Results
Description of the datasets
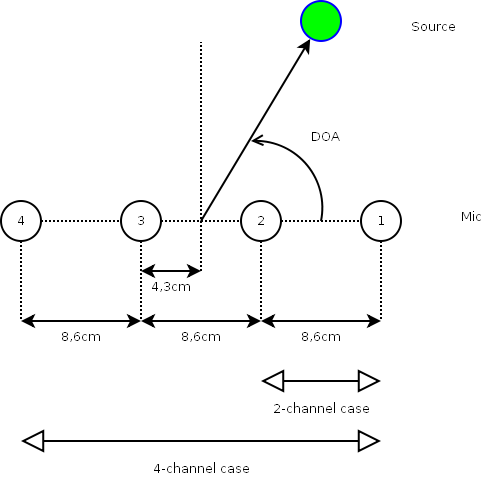
We have development data and test data which include multichannel speech mixtures in the presence of several kinds of real-world background noise. All data are exactly 10 second long and sampled at 16 kHz.Two types of microphone arrays are considered (See Fig. 1):
- Stereo
- 4-element uniform linear array
The microphones are omnidirectional and the distance between adjacent microphones is 8.6cm. For the stereo case, microphones 1 and 2 were used as described in Fig. 1.
Recording noise signals
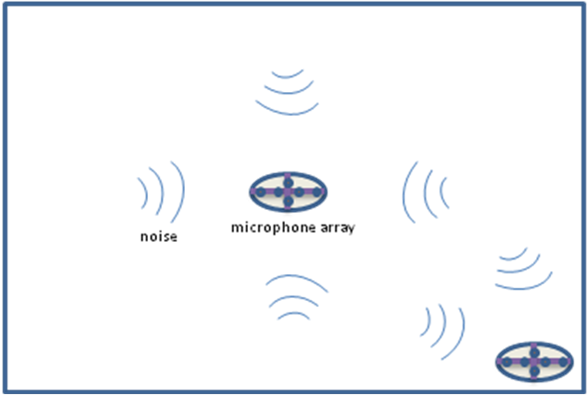
Noise signals are live recorded in three different real-world noise environments:- (Su) Subway car
- (Ca) Cafeteria
- (Sq) Square
In each noisy environment, noise signals are recorded at two different positions within the environment (see Fig.2).
- (Ce) Center: noise is more isotropic
- (Co) Corner: noise may not be very isotropic
Generating mixture signals
Instead of recording the source signals and noise at the same time, we recorded them separately and added them together afterwards. This is because we need to have access to the contribution of each source and that of noise in order to evaluate performance criteria such as SIR.For (Su) and (Ca) where there is reverberation, we recorded source signals in an experimental room. Since we recorded them within just a few hours, physical conditions like the temperature and the pressure should not be so varying. Therefore, one will be able to assume reasonably that the velocities of propagation of source signals are the same. For (Sq) where there is little or no reverberation, we simulated the source contributions to the microphones under the assumption of spherical wave propagation. The velocity of sound was assumed to be 340 m/s. The number of audio sources in the mixtures is either one or three. The DOA (azimuth) of the source signal is measured from the array centroid (the midpoint of microphones 2 and 3 in the 4-microphone case and the midpoint of microphones 1 and 2 in the stereo case). The definition of the DOA for the 4-microphone case is illustrated in Fig. 1. Be careful that we define the DOA as the angle from the array axis to the source direction.
Dataset
We have a development dataset “Dev” and test datasets “Test1” and “Test2”. In Test1, noise was recorded in exactly the same environment as in Dev (e.g. cafeteria A for both Dev and Test1). On the other hand, in Test2, noise was recorded in a different place from that in Dev (e.g.cafeteria A for Dev and cafeteria B for Test2). Since we could not afford to record in different subways, we used noise when the train is moving for Dev and Test1 and noise when the train is standing at a station for Test2.
The databases were designed to evaluate the effect of 4 parameters:
- the type of noise environment: (Su), (Ca), or (Sq)
- the location within that environment: (Ce) or (Co) [only (Ce) for (Su)]
- the number of sources: 1 source or 3 sources
- the number of microphones: 2 mics or 4 mics
- (Ca) and (Sq): (2 locations) x (2 # of sources) x (2 # of mics) x (2 samples) = 16 mixtures
- (Su): (1 location) x (2 # of sources) x (2 # of mics) x (2 samples) = 8 mixtures
We provide monaural source wav files, multichannel source image wav files, multichannel noise wav files, and a DOA file including the azimuth of each source as well as a multichannel mixture file for Dev. Since the source DOAs were measured geometrically in the (Su) and (Ca) cases, they might contain a measurement error up to a few degrees; on the contrary, there is no such error in the (Sq) case, because the source contribution to the microphones was simulated.
On the other hand, for Test1 and Test2, we provide the mixture file only.
Development data
- Download Dev.zip
 (136 MB) ([modified Feb.22]: modification announcement, Feb. 22)
Test data
For more information about the datasets, please refer to this document.
[Notice(Found in 2011)] The mixtures dev_Ca1_Co_A_mix.wav and dev_Ca1_Co_B_mix.wav are identical (this is a mistake that will be corrected in future evaluations).
Tasks
We propose the following 3 tasks:- Source DOA estimation: estimate the DOA(s) of the audio source signal(s)
- Source signal estimation: estimate the single-channel audio source signal(s)
- Source and noise spatial image estimation: estimate the multichannel contribution to the microphone signals of each source and that of noise
Submission
Each participant is asked to submit the estimation results of his/her algorithm for tasks 2 and/or 3 over all or part of mixtures in the test dataset. In addition, the estimation results for task 1 may be submitted.
Due to the large amount of data, each participant should make his results available online in the form of a tarball called results.zip.
The included files must be named as specified in this document (see Section 2). Please note that it does not matter if a noise source is not distinguished from the speech sources, i.e. a separated speech source can be named as a noise source and vice versa. In the evaluation process, all source orderings are tested and the ordering leading to the best SIR is selected.
[SUBMISSION CLOSED on Apr.21]
Each participant should then send an email to "nobutaka.ito (at) irisa.fr" with Cc to "gowr0001 (at) umn.edu" providing
- contact information (name, affiliation)
- basic information about his/her algorithm, including its average running time (in seconds per test excerpt and per GHz of CPU) and a bibliographical reference if possible
- the URL of the tarball(s)
Reference software
Please refer the previous SiSEC2008 page
Evaluation criteria
As for the evaluation of the estimated DOA of the source signals in task 1, we will provide the absolute differences between the true DOA and the estimated one.
Based on the evaluation method for source signal estimation in SiSEC2008, we propose to evaluate the estimated source signal(s) in task 2 via the criteria defined in the 「http://bass-db.gforge.inria.fr/bss_eval/|BSS_EVAL] toolbox. These criteria allow an arbitrary filtering between the estimated source and the true source and measure interference and artifacts distortion separately. All source orderings are tested and the ordering leading to the best SIR is selected.
Similarly, we propose to evaluate the estimated spatial source/noise image signals in task 3 via the same criteria which were used for the Stereo Audio Source Separation Evaluation Campaign
Several tools for evaluation can be found at previous SiSEC2008 page
In addition, new auditory-motivated objective measures will be used to assess the quality of the estimated spatial source image signals, in the mono and stereo cases. The main features are:
- as in previous evaluations, four performance measures akin to SDR, ISR, SIR and SAR are given: global score, target preservation score, interference rejection score and artifacts absence score
- these auditory-motivated measures were trained on a set of subjective quality ratings obtained from the SISEC 2009 sound material and improve correlation to subjective measures by more than 20% compared to classical SDR, ISR, SIR and SAR
- A preliminary version of this toolbox is available here. It provides a new method to decompose the distortion into three components: target distortion "eTarget" (error signal related to the target source), interference eInterf (error signal related to the other sources) and artifacts eArtif (remaining error signal).
Licensing issues
All files in the datasets are distributed under the terms of the Creative Commons Attribution-Noncommercial-ShareAlike 3.0
Acknowledgment
The task proposers would like to thank Dang Hai Tran Vu for making Fig. 1.
Potential Participants
- Dang Hai Tran Vu
- Ngoc Q. K. Duong
- Nobutaka Ito
- Shigeki Miyabe
Task proposed by Nobutaka Ito & Ngoc Q. K. Duong & Valentin Emiya
Back to Audio source separation top